Antioxidant Activity of Green Tea
| ✅ Paper Type: Free Essay | ✅ Subject: Biology |
| ✅ Wordcount: 2256 words | ✅ Published: 07 May 2018 |
SCREENING AND EVALUATION OF DIFFERENT INDIAN GREEN TEAS FOR THEIR ANTIOXIDANT ACTIVITY
Rashmita Pradhan, Debika Chakraborty, Reshma Priti Ekka and Podili Koteswaraiah
ABSTRACT
Three varieties of green tea grown in different regions of India (Darjeeling, Nilgiri and Assam) along with Tulsi green tea (TGT) and Jasmine green tea JGT) were screened for antioxidant activity. The phenolic compounds were extracted using methanol and the total phenolics (TPC), total flavonoids (TFC) and antioxidant activity of the extracts were determined. The TPC and TFC content of AGT showed the highest with 180.94 ±14.4 mg GAE/g of dry weight and 52.41±2.62 mg CE/g respectively. TGT showed lowest TPC (70.49±4.32 mg GAE/g) and TFC (28.41±1.39 mg CE/g). All the extracts scavenged the DPPH radicals in a dose dependent manner. At 25 ïg concentration, JGT showed higher antioxidant activity (75%) whereas AGT showed lowest activity (54%). JGT also exhibited highest reducing power (2.494, Abs700) and metal chelating activity (76.7%) compared to other extracts. The UV-Vis spectral analysis of diluted extracts showed λmax from 225 to 275nm indicating the presence of phenolic acids and flavonoids. FTIR analysis of extracts revealed strong IR band between 3300-3500cm-1 indicating the presence of hydroxy functional groups of polyphenols.
Key words: Green tea; polyphenols; DPPH radical; reducing power
1. INTRODUCTION
Tea is the most popular beverage worldwide, and its annual consumption per capita is around 40 l. It is especially popular in Japan, but black tea accounts for 80% of global tea manufacture [1]. Green tea is good for diabetics in several ways. It decreases the blood glucose level and improves sensitivity to insulin and enhances antioxidant defences [2,3]. Most of these polyphenols are flavan-3-ols, a class of flavonoids; commonly known as catechins. The main catechins present in green tea are epigallocatechingallate (EGCG), epicatechin-3-gallate, epigallocatechinane epicatechin[4]. The polyphenolic compounds in tea scavenge reactive oxygen species (ROS) through various mechanisms[5]. Number of phenolic compound extracted from green tea has been found to be a good antioxidant against lipid peroxidation and in biological system. The beneficial effect of green tea is due to different kinds of phenolic compounds like epicatachin, epigallocatechingallate, epigallocatechin, epicatechingallate, gallocatechin and catechin[6].
The ROS are produced continuously in living organisms by various metabolic pathways and cause oxidative damage to life important biological molecules such as proteins, membrane lipids and DNA and leads to many diseases, including diabetes, Obesity, hypertension, cancer, Parkinson’s disease, atherosclerosis and immune deficiency. Antioxidants may prevent the biological molecules from oxidative damage caused by ROS and protect the human body from various diseases. Green tea leaves contain up to 30 % of polyphenols on weight basis. GCG showed protective effect against diabetic cataract formation [7]. It has been shown in different animal model and different cell lines that non enzymatic antioxidants such as GSH, ascorbic acid and vitamin E[8]Several epidemiological and clinical studies have indicated that daily intake of fruits and vegetables rich in polyphenols associated with lower occurrence of disease [9]. Hence, polyphenols are viewed as essential for human health to protect from free radicals mediated oxidative damage. Among dietary natural antioxidants, tea is one of the richest source for polyphenols, constitutes up to 30% of its dry weight. Tea is one of the most popular beverages consumed in the world for centuries. More than 300 different kinds of tea are produced worldwide from the leaves of Camellia sinensis by various manufacturing processes.
The present study aimed in examining the effect of geographic variation and climatic conditions on the phenolic profiles and antioxidant activity of three varieties of green tea grown in different regions of India includes Nilgiri, Assam and Darjeeling.
2. MATERIALS AND METHODS
2.1. Chemicals
Catechin, Gallic acid, 1,1-diphenyl-2-picrylhydrazyl(DPPH) were purchased from Sigma. Ferrozine was obtained from Aldrich Chemical Co. Ascorbic acid, trichloroacetic acid (TCA) were obtained from Sisco Research Laboratories (Mumbai, India). All other chemicals and solvents used were of analytical grade.
2.2 Materials
Five different tea varieties Darjeeling, Nilgiri, Assam, Jasmine and Tulsi tea were purchased from retail outlet. They are blended into fine powder and kept in air tight container until used for extraction.
2.3. Preparation of Tea Extract
2 gms of each powder sample were mixed with 100 ml of methanol and was refluxed in a condenser at 600c for 2hours. The supernatant was collected and the residue was again subjected for extraction with 50 ml of methanol for 1hour at same temperature. Both the supernatants were pooled, filtered through whatman No 1 filter paper and subjected to rotary evaporator for concentration. Later the residual solvent was removed by applying high vaccum and the extract weights were measured. The extracts were redissolved in methanol and made up to 20 ml with the same solvent and stored at 4ËšC for further use.

2.4. Determination of Total Phenolic Content
The total phenolic content in each extract was measured by the Folin-ciocalteu assay [10]. 50 microliters (1/20 dilution) of sample was introduced into test tubes and made upto 3ml by using distilled water. To that 0.5ml of Folin-ciocalteu reagent was added followed by 2ml of 20% Na2CO3 after 3 mins of incubation at room temperature. The reaction mixture was then kept in boiling water for 1min and cooled. Then the Absorbance was measured using UV Visible spectrophotometer at 650 nm. The TPC was expressed as milligrams of gallic acid equivalents (GAE)/1gm sample.
2.5. Determination of Flavanoid Content
Total flavonoid content of tea extract was measured by using Aluminium chloride assay reported by [11] using catechin as standard. 50µl (1/20dilution) of sample was diluted with 4ml deionised water. At, zero time 0.3ml of 5%NaNO2 was added followed by 0.3ml of 10% AlCl3. At 6thmin, 2ml of 1M NaOH was added to the mixture. After all this immediately in all the test tube 2.4ml of deionised water was added and mixed up thoroughly. Then it was subjected to UV spectrophotometer at 510 nm against water blank. The TFC was expressed as catechin equivalents (mg CE/g of dry weight)
2.5. Determination of DPPH radical scavenging activity
The free radical scavenging activity of tea extract against 2,2 diphenyl-1-picrylhydrazyl(DPPH) was determined by modified method of[12]. In this assay the antioxidant compound present in green tea react with DPPH, which can donate hydrogen and reduces to DPPH-H. This is monitored by the colour change from deep violet to light yellow and was measured at 517nm on a UV visible light spectrophotometer.
2.6. Determination of Reducing Power
The reducing power of tea extracts was determined by[13].Polyphenols have the reducing ability which react with potassium ferric cyanide and gives potassium ferrocyanide which then reacts to ferric chloride to form ferrous ferric complex with absorption maxima at 700nm.
The assay was done in triplicates as well as dose dependent manner (100µg,200µg,300µg,400µg and 500µg).100µg of tea extract of 1/50 dilution extract in methanol was mixed with 2.5 ml of phosphate buffer (0.2 M) and 2.5 ml potassium ferricyanide (1%). The mixture was incubated in water bath at 500C for 20 min. Then 2.5 ml of 10%trichloroacetic acid was added to the each tube to arrest the reaction and then centrifuged at 5000 rpm for 10 min. The upper layer of solution (2.5 ml) was mixed with 2.5 ml of distilled water and a freshly prepared 0.1 % ferric chloride solution (0.5 ml). The absorbance was measured at 700 nm. Ascorbic acid (20μg/ml) was used as standard. The blank was prepared with all the reagents except extract or standard. The Increased absorbance at 700 nm of the reaction mixture indicates increase in reducing power of the extract.
2.7. Determination of Metal Chelating Activity
The metal chelation assay was done according to the [14] with slight modification. The assay was done in dose dependent manner (1mg, 2mg, 3mg, 4mg and 5mg). Extracts with different volume were mixed with 3.9 ml of methanol and 50µl of FeCl2 (2mM). The reaction was initiated by the addition of 200µl of Ferrozine (5 mM). The solution was thoroughly mixed and allowed to stand for 10 min at room temperature. Then, the absorbance of reaction mixture was measured at 562nm against blank. The blank contains 50µl of distilled water instead of FeCl2. The control contained all the reagents except extract. All tests and analysis were done in triplicate and average values were taken. The % of metal chelating activity was calculated using the following formula: [(Ac-As)/Ac] x 100. Where AC is the absorbance of the control and AS is the absorbance of the extract/standard.
2.8. UV-Visible spectroscopy
To detect the UV-VIS spectrum profile of the tea extracts (1/20dil).The extract was scanned in the
Wavelength ranging from 200-800nm by using UV spectrophotometer.
2.9. FTIR
The characteristic peaks were detected by using Perkin Elmer spectrophotometer system with a range from 400-4000cm-1to detect their functional characteristic peaks and groups.
2.10. Statistical analysis:
All the experiments were performed in triplicates and the results are expressed as mean ± standard deviation (SD).
3. RESULTS AND DISSCUSSION
3.1. Preparation of tea extracts
Methanol was used as the solvent for green tea extract. Different authors have used different solvents like methanol[15], acetone[16], ethyl acetate[17].
3.2. Determination of Total Phenolic Content
The polyphenolic content of different tea were determined using Folin-ciocalteu assay. It is the standard method used widely to determine the polyphenol content in different compounds and extracts. Tea polyphenols are known for their anti cancer[18] anti diabetic and other health benifits. The contents were expressed in mg GAE/gm of dry weight. The total phenol content of different green tea was shown in Fig.1. The TPC ranged from 70 to 185mg GAE. In this study, AGT showed the maximum polyphenol content among the regular green teas (180.94±14.39mg GAE/gm) followed by DGT(174.301± 21.03mg GAE/gm) whereas TGT showed the lowest polyphenol content with 10.49±4.32mg GAE/gm which is not in agreement with Dubeau et al 2010 where it is reported that Darjeeling-tea is having the highest antioxidant activity. A different type of solvents also effects the polyphenolic profile in green tea [19].

Fig. 1. Total phenolic content of methanolic extracts of different green tea varieties. Values are expressed in mean ± SD (n=3).
3.3 Determination of Total Flavonoid Content
The flavonoid content ranged from 25 to 55mg CE. Flavonoids are the polyphenols which plays a defensive role in cardiovascular disorders [20],free radical quenching. The flavonoid content in the extracts were estimated by AlCl3 assay. It is expressed in mg CE/gm. The flavonoid content in different teas are given below in Fig.2. Among all the green tea, AGT showed the highest flavonoid content with 52.41±2.62mgCE/gm while TGT showed the lowest with 28.41±1.39mg CE/gm.

Fig. 2. Total flavonoid content of methanolic extracts of different green varieties. Values are expressed in mean ± SD (n=3).
3.4. Determination of DPPH radical scavenging
activity
DPPH is widely used to examine free radical scavenging activity. The DPPH free radical scavenging activity of tea extracts were determined by the Brad William assay. All extracts showed the free radical quenching activity (Fig.3).

Fig. 3. DPPH radical scavenging activity of green tea extracts at different concentration.
3.5. Determination of Reducing Power
Reducing power was estimated by dose dependent manner (Fig. 4a and 4b). AGT exhibit the highest reducing power capacity of 0.579(Abs700) followed by JGT with 0.525(Abs700) whereas TGT showed the lowest 0.467(Abs700).

Fig 4a. Reducing power of different green tea ex tract.

Fig. 4b. Reducing power of different green tea ex tract at different concentration.
3.6. Determination of Metal Chelating Activity
All tea extracts showed the metal chelating power and the activity increased with increase in concentration from 1mg to 5 mg (Fig.5). Metal chelation assay showed a contradictory result in comparision to other assays. JGT showed the highest metal chelating activity percentage (76.38%) followed by DGT(73.62%) among regular green teas.
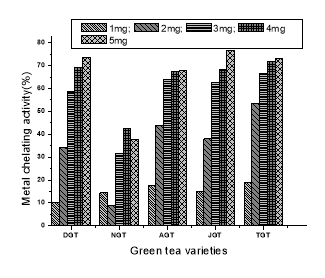 Fig.5. Metal chelating activity of different green tea in different concentration.
3.7. UV–Visible Spectrophotometric Analysis
Figure 6a to 6e represents the UV Visible spectra of the diluted methanolic extracts of different green teas. All the extracts showed absorbance maximum from 225 to 275 nm indicating the presence of phenolics and flavonoids [21].
DGT

Fig. 6a. UV-Vis spectrum of DGT extract
NGT

Fig. 6b. UV-Vis spectrum of NGT extract
AGT

Fig. 6c. UV-Vis spectrum of AGT extract
JGT

Fig. 6d. UV-Vis spectrum of JGT extract
TGT

Fig. 6e. UV-Vis spectrum of TGT extract
3.6. FTIR spectroscopy
FTIR is valuable technique for the identification of pure compounds or plant extracts based on the functional groups. The FTIR spectrum of the compound is unique and used as a molecular fingerprint [22]. The functional groups of the active components present in extract were identified using the FTIR Spectrum based on the peaks values and wavenumber in the region of IR radiation. The results of FTIR analysis confirmed the presence of hydroxy functional groups (3300-3500 cm-1) in the extracts (Fig 7).
DGT

Fig. 7a. FTIR spectrum of AGT extract
NGT

Fig.7b. FTIR spectrum of NGT extract
AGT

Fig.7c. FTIR spectrum AGT extract
JGT

Fig.7d. FTIR spectrum of AGT extract
TGT

Fig. 7e. FTIR spectrum of TGT extract
Conclusion
In the present study different green teas of Indian origin were screened for their antioxidant activity. Among the green tea tested, AGT showed the highest polyphenol and flavonoid content while TGT showed the lowest. All the extracts exhibited DPPH radical quenching and metal chelating power. JGT showed higher reducing power and DPPH radical scavenging activity. UV visible absorption spectra analysis confirmed the presence of phenolic acids and flavonoids in the green tea extracts. FTIR analysis indicated the presence of hydroxy functional groups. DGT, NGT and AGT showed common signature in their spectra. The results indicate that Jasmine green tea (JGT) exhibited higher antioxidant potential and is a rich source of natural polyphenol antioxidants.
Aknowledgment
The authors wish to thank the Management, VIT University, Vellore for providing all the necessary facilities to carry out this research work.
Cite This Work
To export a reference to this article please select a referencing stye below:
Related Services
View all


DMCA / Removal Request
If you are the original writer of this essay and no longer wish to have your work published on UKEssays.com then please click the following link to email our support team:
Request essay removal