Natural and Shale Gas Monetization
| ✅ Paper Type: Free Essay | ✅ Subject: Engineering |
| ✅ Wordcount: 3960 words | ✅ Published: 30 Aug 2017 |
According to the US Central Intelligence, Russia has the highest proven reserves of Natural gas in the world, being this approximately 24.2% of them. Followed by Iran, Qatar and United States (Central Intelligence Agency, 2016) It is good to mention that United States has bigger reserves in comparison to earlier years, because of the Shale Gas Boom, which is not included in the other countries reserves.
Table 1: 4 first World Natural Gas Producers
|
Rank |
Country |
(Cu m) |
Date |
|
Total |
World |
197,200,000,000,000 |
1 January 2016 est. |
|
1 |
47,800,000,000,000 |
1 January 2016 est |
|
|
2 |
34,020,000,000,000 |
1 January 2016 est |
|
|
3 |
24,530,000,000,000 |
1 January 2016 est. |
|
|
4 |
10,440,000,000,000 |
1 January 2016 est. |


1.1. Natural Gas Resources
Very small quantities of Soviet gas had been exported to Poland since the late 1940s, the idea of large-scale imports of Soviet gas into Western Europe seemed to some both unworkable and unwise. The focus of Soviet natural gas production was moving from the Volga/Urals, North Caucasus and Ukraine, to Siberia, which would require additional transportation amounting to several thousand kilometers. (Stern, 2001)
The transport problem was resolved by the Siberian gas development of the 1970s and 80s based on the super-giant fields discovered at Medvezhe, Urengoy and Yamburg. With multiple strings of largediameter pipeline being built from Siberia to the Ukraine, it required only a relatively short extension for one or two pipelines to reach Europe (map 2). Between 1970 and 1980 deliveries of Soviet gas to Western Europe increased from 3.4 Bcm to 26 Bcm. By 1990 gas exports had risen to 109 Bcm and Western Europe, with 63 Bcm of imports, was the largest customer for Soviet gas. (Stern, 2001)
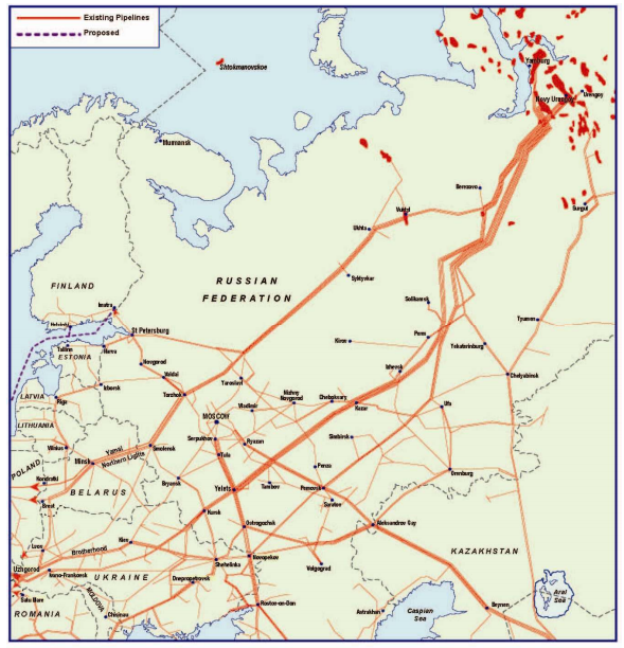
Figure 1: Old and New Pipelines
In the context of increasing demand and declining supply, the importance of Russia as a partner in European gas becomes abundantly clear. The opportunity for a much closer natural gas partnership between Russia and Europe is based on firm foundations (Stern, 2001):
Russia has huge discovered resources of gas available for development. Russia has gas reserves of 48 trillion cubic metres (TCM) according to the Russian A+B+C1 classification. Gazprom estimates that it has 28 TCM of reserves in fields in production or being prepared for development, compared with an international estimate of 18.5 TCM of proven and probable reserves in those same fields. Whichever estimate is chosen, it is clear that Russian reserves overwhelm all other gas reserves available to Europe with the exception of Middle East countries. Russian gas production of over 600 Bcm of gas in 2003 is projected to increase to 730 Bcm by 2020 (Stern, 2001).
Over the past 35 years, pipeline infrastructure has been established for delivery of very substantial volumes of gas from Russia to Europe (Stern, 2001).
As far as Russian exports to Europe are concerned, compared with the position in 1973 when just four countries were supplied with less than 7 Bcm of gas, thirty years later nearly 140 Bcm was exported to nineteen countries (Stern, 2001).
Russian gas exports to Europe passing through Ukraine from where a number of pipelines travel west, delivering gas to central and northern Europe. Some lines travel south through Moldova to south eastern Europe and Turkey; others pass through Hungary delivering to the Balkan countries. In 1999, the Yamal pipeline began transporting gas through Belarus and Poland to Germany, providing an alternative to the routes through Ukraine. There is also a pipeline which passes via St Petersburg taking gas into Finland. Another major pipeline takes Russian gas across the Black Sea to Turkey; the Blue Stream pipeline – which started transporting gas in 2002 – set a new record by laying pipeline in water depths exceeding 2000 meters (Stern, 2001).
The next major pipeline bringing additional Russian gas to Europe is expected to be the North European Pipeline (NEP) running from Vyborg in north west Russia via the Baltic Sea to Germany and potentially on to the UK. The possibility of the North European pipeline being able to deliver gas to Sweden and Denmark is also under consideration (Stern, 2001).
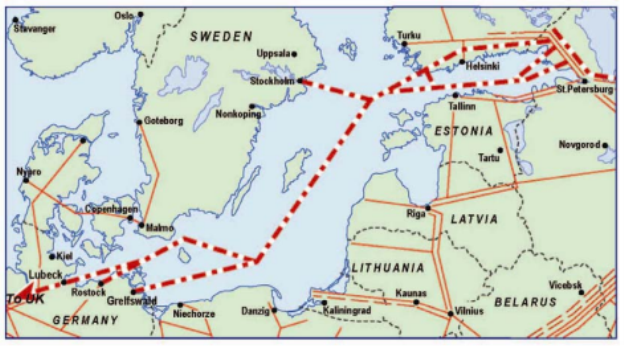
Figure 2: New Pipelines from Russia
On May 2 1, 2014 the media reported that China and the RF reached a 30-ycar gas deal worth about $400 billion. Some sources said the deal had been in the making for about a decade.
On Nov. 10, 2014 China and the RF signed a second gas deal in which the RF would supply China with 30 Bern of natural gas via the western route over 30 years. This would require construction of the pipeline Power Sibcria-2. Gazprom signed the 30-ycar contract with China’s National Petroleum Corporation (CNPC) (Reineberg, 2017).
The two combined natural gas deals between Russia and China would amount to about 68 Bern which is considerably more than the 45 Bcm the RF provides Germany each year. The gas deals would make China Russia’s most important customer, second only to Germany (Reineberg, 2017).
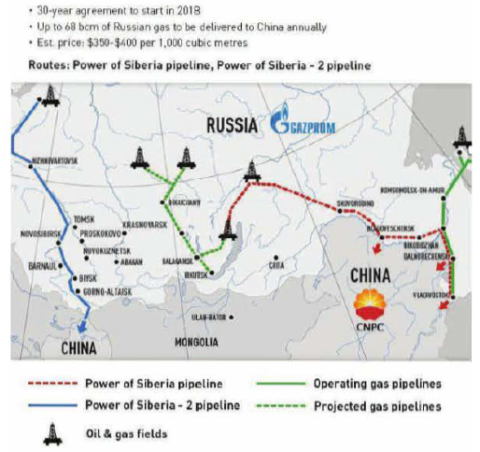
Figure 3: New Pipelines to China
In December 2014 the South Stream pipeline project to supply gas to the south eastern part of Europe was argued in yet another sign of the weakening and decreasing of Russia’s energy collaboration with Europe EU. The diagram above is available from Gazprom and displays what the scheme would have seen like once completed (Ashton, 2015).
This project was intended to reduce risk involved in transporting gas to the Europe by evading Ukraine, much as Gazprom’s northern gas pipeline to Germany has done. But a flagging political condition means the European units no longer focusing only supply risk and is also focusing on transportation risk. To mitigate the risk of supply, Europe’s goal is to reduce volume of Russias’s supplies (Ashton, 2015).
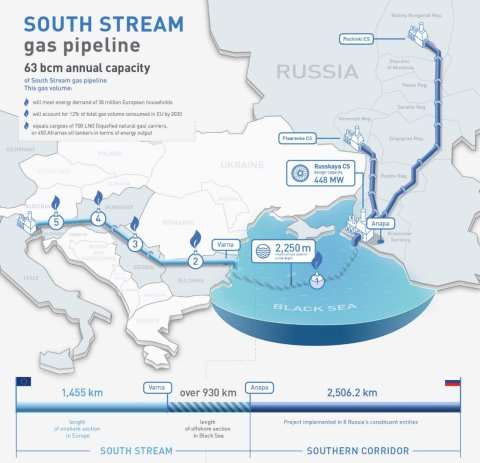
Figure 4: New Pipelines to EU
1.2. Natural Gas Reserves
In 2015 Russia`s natural gas reserves (ABC1) amount to 50.2 tcm, which is one percent more than in 2014. The largest gas fields are located in Western Siberia oil and gas bearing province. The growth in gas reserves was provided by gas fields in the Yamal Peninsula Bovanenkovo, Kharasaveyskoye, Yuzhno-Tambeyskoye, Eastern Siberia Kovyktinskoye, Russian Far East Chayandinskoye and on the Arctic Shelf Shtokman, Kruzenshternskoye. In European Russia the central gas reserves are concerted in Astrakhan field and Orenburg areas. In the following graph we can see the reserves and their defined amount .

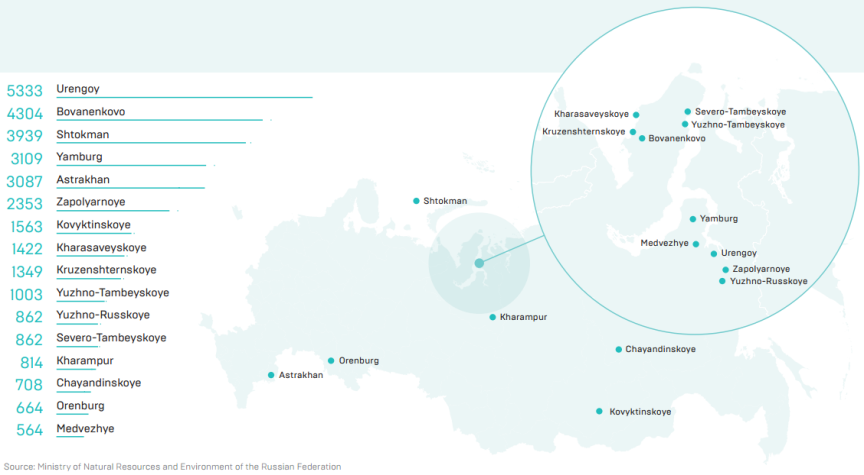
Figure 5: Russia`s largest natural gas fields: reserves
About 80% of Russia`s NG natural gas production is developed in the Nadym-Pur-Taz region, Yamalo-Nenets AO.
In 2014, three gas fields – Zapolyarnoye, Urengoy, Yamburg – accounted for more than 40% of country`s gas production. In 2012, gas production was started at the Bovanenkovo field (Yamal Peninsula), and it accounted 42.8 bcm in 2014. It is expected that to 2020 Bovanenkovo will be the largest gas producing field in Russia. Positive production dynamics also featured on Yurkharovskoye field and Beregovoye field (Analytical Center for the Government of the Russian Federation, September 2016).
Table 2: Major producing gas fields in Russia
|
Major producing gas fields, (bcm) |
2013 |
2014 |
|
Zapolyarnoye |
117,5 |
97,9 |
|
Urengoy |
90,6 |
85,5 |
|
Yamburg |
75,3 |
62,8 |
|
Bovanenkovo |
22,8 |
42,8 |
|
Yurkharovskoye |
38,4 |
39,0 |
|
Yuzhno-Russkoye |
25,1 |
25,0 |
|
Lunskoye |
16,4 |
16,6 |
|
Orenburg |
16,9 |
16,3 |
|
Beregovoye |
10,8 |
11,2 |
|
Astrakhan |
11,7 |
11,1 |
|
Medvezhye |
12,2 |
10,4 |
In 2015, Russia`s natural gas and associated petroleum gas production amounted to 633.4 bcm, which is 0.9% less than in 2014. The decrease was caused by significant reduction of natural gas consumption in Russia. In 2010-2015, the gas supply to the domestic market decreased by 24.8 bcm, or by 5.3%.
In 2015, Russia`s natural gas exports increased by 7.1% year on year to 200 bcm. Natural gas imports of the major importers of Russian gas remained relatively stable. A significant decrease was recorded in supplies to the Ukraine. (Analytical Center for the Government of the Russian Federation, September 2016).
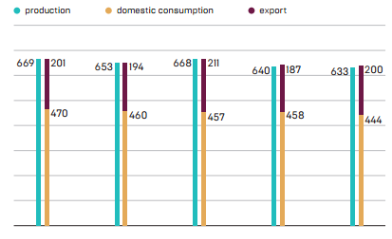
Figure 6: Natural gas in Russia: production, consumption and exports (2011-2015)
In 2015, 79.2% of natural gas production in Russia was provided by Yamalo-Nenets, AO, which is 1.1 pp lower than in 2014. In 2010-2014, YNAO share in Russia`s gas production was 80-83%. In 2015 to 2014 gas production significantly increased in Krasnoyarsk region and Sakha. The largest drop was observed in YNAO (-2%, or -11.6 bcm).
Table 3: Russia’s natural gas production by region
|
Region |
2015, bcm |
|
Yamalo-Nenets |
501 |
|
Khanty-Mansi |
33 |
|
Sakhalin |
28 |
|
Orenburg |
20 |
|
Krasnoyarsk |
11 |
|
Others |
41 |
1.3. Natural Gas Consumption and Production
In 2014, the production of electricity and heat energy provided 48.3% of Russia`s natural gas consumption, which is 3.5 pp less than in 2013. Gas consumption decreased by 6.4% in these two sectors, by 2,2% in industry and increased by 0.1% in residential sector (Analytical Center for the Government of the Russian Federation, September 2016)..
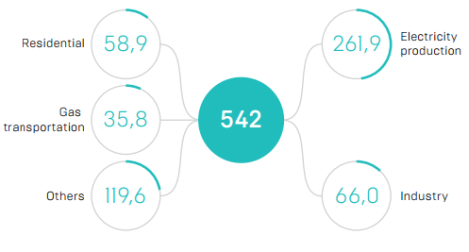
Figure 7: Russia`s natural gas consumption by sector, 2014, mtce
Russia`s LNG Liquid Natural Gas exports and production is developed in a single plant on Sakhalin Island, with a capacity of 9.6 mtpa. LNG is exported by sea to the Asia-Pacific countries, mainly to Japan. There are LNG Liquid Natural Gas plants projects in Russia. The plant on the Yamal Peninsula is under construction, with an installed capacity of 16.5 mtpa, start at 2017-2018. It is also planned to implement projects in Vladivostok and the Baltic Sea and Sakhalin Island (Rosneft). In 2015, Russia’s share in the global LNG market was 4% (Analytical Center for the Government of the Russian Federation, September 2016)..
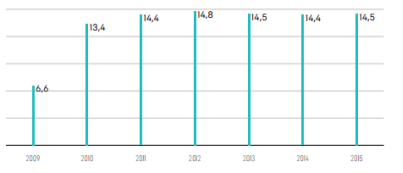
Figure 8: LNG production and exports in Russia (2009-2015), bcm
Russia`s CNG consumption is 450 mcm, or about one percent of the world total. The natural gas consumption in transport is a priority of Russia`s gas industry development. State subsidies for regions are aimed to stimulate the growth of CNG consumption. Gazprom plays the main role in development of the Russian NGV market. Other participants are Rosneft and Novatek (Analytical Center for the Government of the Russian Federation, September 2016)..
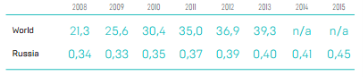
Figure 9: CNG consumption in road transport, 2008-2015, bcm
1.4. Natural Gas Industry
The current Russian gas industry is tightly related to the Soviet gas industry structure as it evolved in the 1970s and 1980s. It was characterized by exploitation of huge deposits and long distances between production sites and consumption centers, which required construction of a comprehensive trunk pipeline network. These characteristics lent themselves to economies of scale and – in line with Soviet thinking – a unified industry structure intended to minimize costs of extraction and transportation of natural gas. In the centrally planned economy gas was prioritized in electricity and heat production, thereby making more oil available for highly profitable export. The regulated domestic price of natural gas was very low. Natural gas was distributed according to priorities in the centrally planned economy. Consumption of various users – power stations, industrial burners and cooking in vast apartment complexes – were usually not measured but estimated according to technical standards of energy needs. The prioritization of natural gas in electricity and heat generation is clearly evident in the consumption structure today; use of gas in the power sector amounts to 40 percent of total gas consumption in Russia (Aune, Golombek, Moe, & Rosendahld, 2015).
In the 1970s and 1980s extraction and transportation of gas were organized within the Soviet Ministry of the Gas Industry. Then in 1989 a new entity, Gazprom, was established. It got control of the entire Soviet unified gas supply system and was also given a regulatory role. This type of agency was something new – an entity outside the ministry structure – although it was state owned.
When the economic reforms in Russia started for real in 1992, an important element was the creation of new industry organizations. Notably this happened in the oil industry where several new companies were formed and subsequently privatized. In the gas sector the situation was different. The top management of Gazprom maintained that the technical characteristics of the gas industry required a centralized organizational structure. These arguments won over reformers who argued that a split-up of the production side was desirable. In 1992, Gazprom was transformed into a jointstock company, which was subsequently partly privatized. The state, even if it had a minority stake of some 40 percent, retained key control, but generally the company became independent.
The new company obtained ownership of all the major physical assets of the Russian gas industry for free. In addition, the functions of the new company were extended to include roles which had earlier been covered by bodies outside the industry: investment and output targets, which had previously been decided by central planning organs, now became part of the internal processes in Gazprom. Distribution to final consumers, which used to be the remit of a separate structure, now became a business activity of Gazprom. Gas exports, which earlier were managed by a special foreign trade organization outside the gas industry, now became part of the activities of the company. In the end, the gas industry became more centralized and monopolized than it had been in the Soviet system.
Gazprom did not only get new privileges, it also inherited old obligations. It was expected to continue to supply gas domestically at very low prices, but in exchange the company was allowed to keep a considerable share of the export revenues. Thus a situation emerged were domestic supplies became almost a secondary activity compared to exports, where the big money was earned. Domestic supplies were, however, in volume terms about four times higher than exports to Europe. This arrangement can only be understood in the context of the serious economic crisis and restructuring taking place in the 1990s. Maintaining stable gas supplies was of paramount importance for social stability, and low gas and electricity prices were important instruments to ensure this goal. Gas continued to be distributed like in the centrally planned economy: consumers had to obtain permission to take gas in certain volumes, and new consumers could not freely choose energy sources. Gas was, more than other fuels, a subsidized commodity and was de facto rationed (Aune, Golombek, Moe, & Rosendahld, 2015).
1.5. Natural Gas Pricing
Starting rather early in the 1990s, gas prices were in fact increased – but from a very low level. By 1996 the average official gas price was around 250 roubles per 1000 m3 (corresponding roughly to 45 USD). But with a deep economic crisis most of Gazprom’s customers were not able to pay the increasing bills. Many turned to surrogates for payment: goods, shares in enterprises and various services. Others did not pay at all. Gazprom reported that in 1998 their domestic consumers paid for 28.5 percent of the gas deliveries only. According to OECD , only 16 percent of these deliveries were paid in cash. This was the nadir of Gazprom. Then the situation improved: After the economic crisis in 1998 and subsequent rouble devaluation, both Russian exports and the general economy picked up. Gazprom was now allowed to take tougher measures against non-paying customers, and cash payment was widely enforced in the state sector. The company’s take-over of local distribution organizations also helped increasing the share of paying customers. By 2000, 62 percent of the delivered gas was paid for, see OECD, and by 2004 Gazprom reported that 98 percent of the domestic deliveries were paid in cash, see OECD (2004). This development also reflects that gas prices had been allowed to fall in real terms: by 2000 gas prices were 62 percent below the 1996 level, see OECD (Aune, Golombek, Moe, & Rosendahld, 2015).
In the transition from the centrally planned economy to a market oriented system, Gazprom had been given production infrastructure and pipelines that had been built and financed by the Soviet state (see discussion above). Thus Gazprom had very low capital costs and the company could therefore handle losses in the domestic market as long as it kept the export income. But as years went by the need for renewal of the pipeline network as well as investment in production capacity grew. Gazprom therefore started paying more attention to the domestic market, first by devising schemes for payment when cash was lacking, and then, as the general economic crisis subsided in the early 2000s, to argue for domestic price increases: prices should cover operating costs and also allow for accumulation of investment funds. Gazprom’s argumentation was helped by Russia’s negotiations to become a WTO member: the Russian government committed to reduce subsidies to domestic customers and raise gas prices to USD 37-42 per 1000 m3 by 2006, and further to USD 49- 57 by 2010, see OECD. Despite the decision to increase the price of gas from 2000, by the end of 2003 the regulated average gas price for industry customers was still low: it corresponded to USD 24 per 1000 m3, see OECD. A plan for raising the regulated gas price to European netback parity – European price minus the extra transportation costs and duties on export – was authorized by the Russian government in May 2007,); this plan addressed both the concerns of the WTO and Gazprom’s request. The government foresaw a stepwise increase whereby the domestic price for industry would reach European netback parity by 2011. In 2007, experts considered the plan as feasible even though the price for industrial consumers corresponded to USD 44 per 1000 m3 -the netback price would have been USD 145 per 1000 m3. However, the international oil price increases in the following years implied that the target gas price was steadily increasing because the export gas price was linked to oil. In 2013, the netback price would have been USD 230 per 1000 m3, see Henderson and Pirani, a price level that would have had a detrimental impact on most Russian consumers. In the end the government therefore postponed the netback goal, first to 2014 and later to 2018 (Aune, Golombek, Moe, & Rosendahld, 2015)..
By 2013 the regulated price had reached USD 105 per 1000 m3, see IEA. Still, according to Gazprom this was not enough to cover investments needed to sustain production in the long run. Gazprom continued to argue that a European netback price should be the goal in order to secure the viability of the gas industry as well as enhance economic efficiency: “undervalued prices negatively affect the domestic economy, because there is no favorable environment for promoting gas- and energy-savings as well as for developing high-tech industries”. For some years the government’s policy was more or less in line with Gazprom’s wishes: in 2010 the government decided to increase gas prices by 15 percent annually until 2015 (Aune, Golombek, Moe, & Rosendahld, 2015)..
There was, however, growing concerns that higher domestic gas prices would weaken the competitive position of the manufacturing industry and hamper economic growth. These concerns were enhanced by the significant fall in gas prices in the United States because of the shale gas revolution.3 In the end the policy was adjusted: in the fall of 2013 the government decided to freeze gas prices until, then index the price to inflation, and after 2016 let gas prices grow slowly, see Table 1. According to this plan, gas prices to industry users may on average increase by 3.2 percent annually between 2016 and 2030,. This is supposed to result in a domestic industry gas price slightly above 70 percent of the netback price by 2030. For households, the plan is to increase prices at a rate slightly higher than the one for industry – 3.5 percent (Aune, Golombek, Moe, & Rosendahld, 2015)..
Table 4: s Gas price development plan. Annual growth rates
|
2016-2020 |
2021-2025 |
2026-2030 |
2016-30 |
|
|
Industry price |
4.4 |
2.9 |
2.1 |
3.2 |
|
Household price |
4.5 |
3.5 |
2.6 |
3.5 |
To sum up, after the establishment of Gazprom in 1989 the gas industry first became more centralized and monopolized than it had been in the Soviet system. Since 1990, prices of gas have increased considerably but they are still far below the netback price. Whereas Gazprom for years has been pushing for a higher price, the most recent plan for domestic Russian gas prices indicates only a moderate increase in prices (Aune, Golombek, Moe, & Rosendahld, 2015)..
1.6. Natural Gas Monetization Techniques
The foundations of Russia’s gas export business were laid during the Cold War. The trade was able to develop despite political opposition partly because West European governments believed gas could be a force for peace and partnership and prosperity. The other main reason has been the excellent track record of first Soviet, and then Russian, gas deliveries to Europe over the past 35 years. With the passing of the Cold War and the increasing need for Europe to develop strong relationships with its energy suppliers, the European Commission proposed an “energy dialogue” with Russia. In 2001 (Stern, 2001):
• The EU imported 21% of its net oil imports (equal to 16% of consumption) and 41% of gas imports (equal to 19% of consumption);
• 53% of Russia’s oil exports and 36% of its gas exports were delivered to the EU, and 45% of Russia’s exports to the EU were energy products.
Within the framework of the dialogue, the EU has agreed to recognize certain Russian gas projects as “energy infrastructure projects of common interest”, specifically:
• the North European gas pipeline for which the EU has agreed to co-finance a feasibility study;
• the Yamal pipeline;
• the Shtokman gas field;
• the Druzhba-Adria oil pipeline link.
In 2015, the gas price in the major markets fell by 30-40% compared to the previous year. The causes for the falling gas prices were decreasing oil prices, warm winters in the USA and Europe and fierce competition inside the industry – with other gas producers, as well as competition with producers of other energy resources, such as coal and renewable ones (Analytical Center for the Government of the Russian Federation, September 2016).
In Green Line we can see the price of Russia comparing in Marron with the price of US.
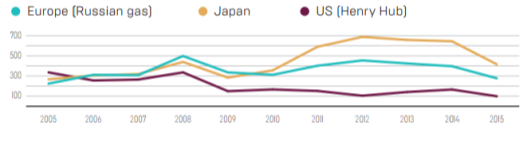
Figure 10: The World Prices of Natural Gas (2005-2015) $/1000 Cubic meters
Among the prices from the natural gas in Russia we have the cost for the last 4 months in United states dollars per MBTU (Indexmundi, 2017)
Table 5: Prices of the Last 4 Months in Dollars per MBTU
|
Month |
Price |
Exchange Rate |
|
oct. 2016 |
4,01 |
1,26 % |
|
nov. 2016 |
4,54 |
13,22 % |
|
dic. 2016 |
5,16 |
13,66 % |
|
ene. 2017 |
5,14 |
-0,39 % |
1.7. Impact of Natural Gas in Russia Economy
According to the following graph, Russia got for 2013 73 Billon of Dollars, which is 14% of its total income; the other products are oil and derivatives of oil.
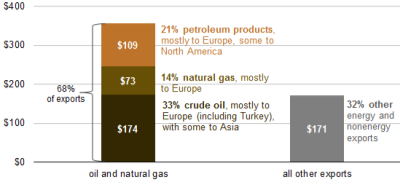
Figure 11: Russia gross export sales 2013 (Billon of US Dollars)
Russia is a major exporter of crude oil, and natural gas. Sales of these fuels accounted for 68% of Russia’s total export revenues in 2013, based on data from Russia’s Federal Customs Service. Russia received almost 4 times as much income from exports crude oil exports and natural gas as petroleum products (Metelitsa, 2014)..
Europe, including Turkey, receives all exports of NG natural gas. Asia, particularly China receives substantial volumes of liquefied natural gas or LNG from Russia. Lately, Russia finalized a 30 year, for about $400 billion to supply China with natural gas from fields in Siberia, which later will increase Russian export incomes. North America imports some Russian petroleum products, particularly oils that are unfinished, used in refineries.
Although Russia exports less crude oil and less natural gas than it consumes locally, domestic sales of crude oil and natural gas are lower in value than exports because of the vertical integration of the NG and oil industry and also the subsidized domestic prices (Metelitsa, 2014).
Almost all Russian oil firms are vertically integrated, owning oil fields and refineries that process crude oil, giving them power in making decisions and regulating price. That is why, these firms can sell crude oil directly to their own refineries at very low prices. Domestic natural gas prices are subsidized too, forcing Russian companies to use export revenue to fund investment in new infrastructure and projects. The energy agency estimates that Russian domestic sales of natural gas and crude oil were nearly about $20 billion in 2013 (Metelitsa, 2014).
Although revenue from local sales of crude oil and natural gas in the year 2003 was significantly low than revenue from exports. (Metelitsa, 2014).
Oil and natural gas activities make up a large portion of Russia’s federal budget. According to the Ministry of Finance, 50% of Russia’s federal budget revenue in 2013 came from mineral extraction taxes and export customs duties on oil and natural gas (Metelitsa, 2014)..
1.8. Future of Natural Gas in Russia and its global impact
Gas demand across Europe increased highly over the past 30 years, most of it used for power generation – shaped by environmental and commercial advantages enjoyed by gas − is the key to continued growth over the next several decades. Imports of gas will be needed increasingly as Europe’s indigenous supply declines and Russia is in a very good position to expand its market share due to its resource endowment, established infrastructure and markets, and track record as a secure supplier (Stern, 2001).
These advantages have been recognised and reinforced politically by an energy partnership between the EU and Russia which recognizes Russia’s growing role as a source of energy and its contribution particularly in terms of gas and oil supplies. In summary, the Russian contribution to European energy balances – both oil and gas – is substantial
Cite This Work
To export a reference to this article please select a referencing stye below:
Related Services
View all


DMCA / Removal Request
If you are the original writer of this essay and no longer wish to have your work published on UKEssays.com then please click the following link to email our support team:
Request essay removal