What Is the Mandelbrot Set and How Is It Constructed?
| ✅ Paper Type: Free Essay | ✅ Subject: Mathematics |
| ✅ Wordcount: 1531 words | ✅ Published: 03 Nov 2020 |
Introduction
One of the most stunning and well-known mathematical images of all time is the Mandelbrot set, named after mathematician Benoit Mandelbrot, who contributed greatly to its study. An image of the Mandelbrot set is shown below:

Figure 1: The Mandelbrot Set (Beyer, 2013)
Many have seen and admired the beauty of this image, and but very few people, including myself prior to undertaking this essay, understand and appreciate the mathematics behind this complex fractal image. Fractals have always intimidated me, with the dizzying spirals and repeating patterns, and so I chose to investigate this topic in hopes of gaining more understanding in this area of mathematics.
The purpose of this essay is to examine the definition of the Mandelbrot set and also how its image is constructed. In addition, I aim to analyze and discern notable patterns in this remarkable image. Most importantly, I hope to gain a greater appreciation of the beauty of this image and communicate my findings in an easily accessible manner. However, in order to comprehend the mathematics behind the Mandelbrot set, we must grasp several other concepts first.
Iteration of the Mandelbrot set function
The formal definition of the Mandelbrot set is the set of values c for which a starting seed of 0 remains bounded upon iteration of the function zn+1 = zn2 + c (Lei, 2000). On first glance, this definition definitely appears confusing, and so it is necessary to clarify some terms.
Iteration simply means the procedure of repeating a process over and over again. In the context of mathematics and the above definition, this process is the utilization of a mathematical function. And as mentioned, the specific function we will be iterating is zn+1 = zn2 + c, where c is a constant (unspecified at the moment). Beginning with a seed, the first value to which the function is applied, we can iterate, using the result of each iteration as the new input for the next calculation:
zn+1 = zn2 + c
z1 = z02 + c ← Inserting the seed, z0, to receive an output of z1
z2 = z12 + c ← z1is used as the new input, and we iterate again
z3 = z22 + c ← The process continues…
z4 = z32 + c…
This process continues, generating a list of values as we iterate. This list of values can be referred to as the orbit of z0. Now, what happens when a value is chosen for c? How will the orbit behave? These questions can be answered by exploring several examples. Suppose the constant 1 is chosen for c. For a seed of 0:

z1 = z02 + c = 02 + 1 = 1
z2 = z12 + c = 12 + 1 = 2
z3 = 22 + 1 = 5
z4 = 26
z5 = 677
…
It is clear that this orbit will tend to infinity. Choosing another value, c = 0, while allowing the seed to remain at 0, we can see that the orbit remains constant:
z0 = 0
z1 = 0
z2 = 0
If another value, c = -1, is chosen, with the seed still remaining at 0, another pattern emerges:
z0 = 0
z1 = -1
z2 = 0
z3 = -1
It can be observed that this orbit cycles between the two values of 0 and -1; or in other words, this orbit has a period of 2.
Various c values have drastically different orbits, as shown in the created histogram graphs below. The plots shown represent orbits for zn+1 = zn2 + c where c = 0.2, -1.75, and -1.85, with the seed still remaining as 0. For c = 0.2, the orbit tends to a fixed point, converging fairly quickly. For c = -1.75, the orbit tends to a period of 3. However, for c = -1.85, the orbit does not appear to conform to any recognizable pattern – we can describe this orbit as chaotic (Devaney, 2006). The following images are all created with the use of Microsoft Excel:
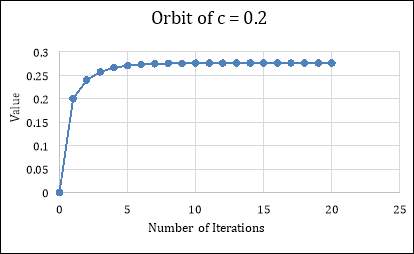
Figure 2: Histogram Graph of the Orbit for c = 0.2
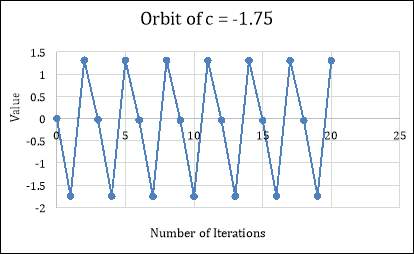
Figure 3: Histogram Graph of the Orbit for c = -1.75
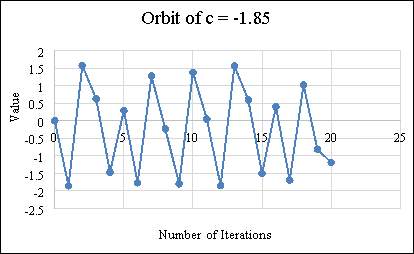
Figure 4: Histogram Graph of the Orbit for c = -1.85
Although the various c values we have explored have revealed several different orbit patterns, it can be observed that the orbit iterated under zn+1 = zn2 + c either tends to infinity or does not. While orbits that do not tend to infinity can behave in different ways – fixed (such as the orbit of c = 0), periodic (c = -1.75), or chaotic (c = -1.85) – what is important to note is that orbits remain bounded or they do not.
This recalls the formal definition of the Mandelbrot set mentioned at the beginning of the essay: the Mandelbrot set is the set of values c for which a starting seed of 0 remains bounded upon iteration of the function zn+1 = zn2 + c (Lei, 2000). With the concepts necessary to understand this definition, this definition now appears simple: a value c is part of the Mandelbrot set if, when iterated with the function zn+1 = zn2 + c with a seed of 0, does not tend to infinity, or in other words, remains bounded. With this in mind, we can conclude correctly that the values of c = 0, -1, 0.2, and -1.75 all belong to the Mandelbrot set.
The Complex Plane
Now that the process of iteration is understood, the construction of the famous Mandelbrot set image can be discussed. However, the definition of the Mandelbrot set mentioned above does not appear to allow for a planar image. How can the image be constructed with one set of values? Benoit Mandelbrot realized the answer: instead of limiting c to real values, c can be expanded to include the set of complex numbers (Peitgen & Richter, 1986).
Applying the set of complex numbers for c allows the usage of the complex plane. For those unfamiliar, the definition of a complex plane (or Argand diagram) is “any 2D graph in which the horizontal axis is the real part and the vertical axis is the imaginary part of a complex number or function” (Smith, 2007). In other words, a complex number a + bi is split into two coordinates: its real part a is plotted on the horizontal axis, and its imaginary part b is plotted on the vertical axis.
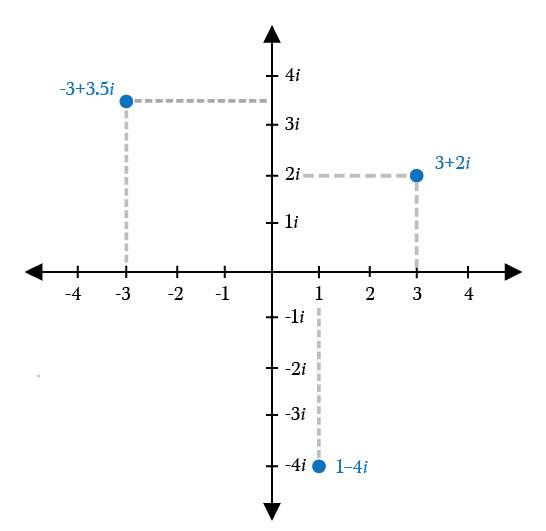
Figure 5: Plotting Complex Numbers on the Complex Plane (Berry, 2017)
How do orbits behave with complex numbers? An example is shown below with the seed at 0 and c = i:
z0 = 0
z1 = 02 + i = i
z2 = i2 + i = -1 + i
z3 = (-1 + i)2 + i = -i
z4 = -1 + i
z5 = -i
z5 = -1 + i
It is clear that the orbit will eventually tend to a period of 2. Again, it is observed that the orbit does not tend to infinity, thus c = i belongs to the Mandelbrot set.
Construction of the Mandelbrot Set Image
With the definition of the Mandelbrot set and the complex plane clarified, the construction of the famous Mandelbrot set image can easily be understood. Simply consider an area of the complex plane at the origin. A massive grid of points is overlaid on the area, and a computer checks whether each point is part of the Mandelbrot set or not, by testing whether the correspondent orbit attached to each point escapes to infinity or not. If the point is part of the Mandelbrot set, it is coloured black; if not, it is coloured white. A completed image may look like the following:
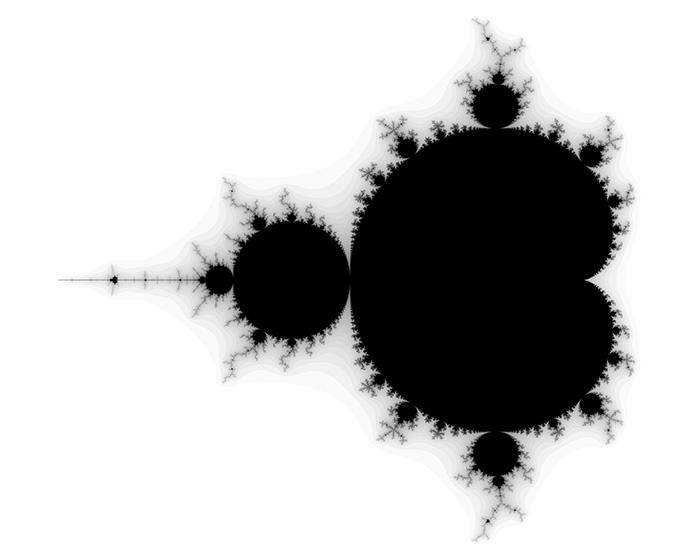
Figure 6: Black and White Mandelbrot Set Image (Bourke, 2002)
Although the above image is unquestionably representative of the completed Mandelbrot set image, many of those who have seen the Mandelbrot set admired a colourful, vivid image marked by beautiful spirals and other impressive patterns. How are these images often seen on the Internet produced?
The points that are part of the Mandelbrot set remain coloured black, but it is the points that are not part of the Mandelbrot set that are coloured. We can recall that any particular orbit either escapes to infinity or remains bounded, but another question can be asked: if an orbit does escape to infinity, how long does it take? This question seems vague – what does it mean to escape to infinity and how can we define how long it takes? Fortunately, a simple criterion has been discovered:
Escape Criterion: Consider a circle of radius 2centered at the origin. If the orbit of any particular c value ever leaves this circle, the orbit will escape to infinity and the c value is not part of the Mandelbrot set (Devaney, 2006).
Now that we have a definition for what it means to escape to infinity, we can define how long any orbit takes to escape – namely, the amount of iterations until the orbit leaves the circle. This allows us to colour the points based on the escape time of each corresponding orbit. An example of such an image is shown below, with the colour bands clearly defined:
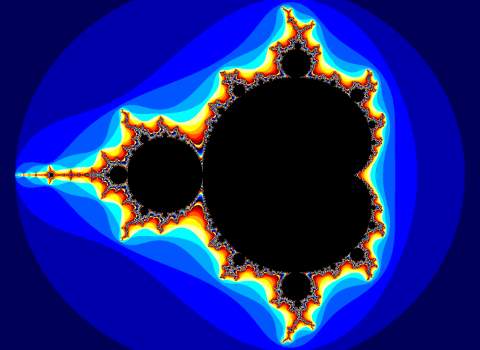
Figure 7: Mandelbrot Set with Defined Colour Stripes (Roelandts, 2012)
Conclusion
Through the course of this essay, we explored the definition of the Mandelbrot set and how iteration is used to define the set, as well as the various fates different orbits can take. We explored the use of the complex plane and the construction of the Mandelbrot set image, as well as the possibilities of colouring the image.
Works Cited:
- Berry, Brett. “Complex Plane Graphic.” Medium, 10 Aug. 2017, https://medium.com/i-math/complex-numbers-explained-fad9a6793019.
- Beyer, Wolfgang. 13 Oct. 2013, https://commons.wikimedia.org/wiki/File:Mandel_zoom_00_mandelbrot_set.jpg.
- Peitgen, H.- O. (Heinz-Otto), and Peter H. Richter. The Beauty of Fractals: Images of Complex Dynamical Systems. Springer, 1986.
Cite This Work
To export a reference to this article please select a referencing stye below:
Related Services
View all


DMCA / Removal Request
If you are the original writer of this essay and no longer wish to have your work published on UKEssays.com then please click the following link to email our support team:
Request essay removal