Determination of the Focal Length of a Convex Lens
| ✅ Paper Type: Free Essay | ✅ Subject: Physics |
| ✅ Wordcount: 1403 words | ✅ Published: 09 Mar 2018 |
AIM: To determine the focal length of converging lens and it’s radius of curvature.
HYPOTHESIS: The relationship between u and v and the focal length f for a convex lens is given by  . Where f is the focal length, u is the distance between the object and the lens v is the distance between the image and the lens. Real and Virtual Images: Lenses produce images by refraction that are said to be either real or virtual.
- Real images are created by the convergence of rays and can be projected onto a screen; real images form on the side of the lens that is opposite to the object and by convention have a positive image distance value;
- Virtual images are formed by the apparent extrapolation of diverging rays and cannot be formed on a screen, whereas virtual images form on the same side of the lens as the object and have a negative image distance value.[1]
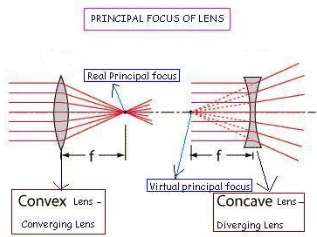
BACKGROUND: For a thin double convex lens,refractionacts to focus all parallel rays to a point referred to as the principal focal point. The distance from the lens to that point is the principal focal length f of the lens. Below is the derivation of the lens formula

Following graphic illustrates a simple lens model:
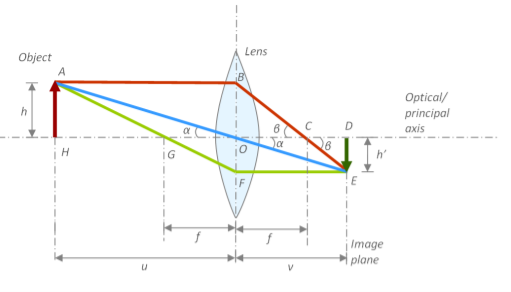
where,
h= height of the object
h’= height of the object projected in an image
G and C = focal points
f= focal distance
u= Distance between the object and the focal point
O= Centre of the lens
v= Distance between the centre of the lens and image plane
Assumptions
- Lens is very thin
- Optical axis is perpendicular to image plane
Proving is true.
Proof
In ΔAHO, 
In ΔEDO, 
∴ 
 —– (1)
In ΔBOC, 
In ΔEDC, 
∴ 
 —— (2)
Equating equations (1) and (2),


Dividing both sides by v,

Hence the formula is proved.
VARIABLES:
Independent: Distance between the candle and the lens
Dependent: Distance (v) from the image to the lens
Control:
- This experiment was conducted in an almost dark room.
- Same sheet of paper used as the screen.
- A stable candle flame
- The time taken for a sharp and focused image to settle
- The size of the candle.
METHOD FOR CONTROLLING VARIABLES: Made sure that the room was sufficiently dark enough to carry out this experiment as smoothly as possible without any entrance of light from the outside. So I pulled down the blinds of the windows and also made sure that there was no draught present in the room that can make the candle flame unstable. Moreover, I waited for around 6-7 seconds for the image to be seen as sharp and focused. And throughout this experiment I used candles of the same make and size.
APPARATUS REQUIRED:
- 2 meter rules
- A white screen
- Candle
- Convex lens
PROCEDURE:
I divided this experiment in to 2 parts, A and B. In part A, I experimented using a single lens at a time, while in part B, I used 2 lens in contact at a time.
Part A:
- Firstly I set up the apparatus as shown in Figure 1 above by making the distances v and u the same. So the image observed on a plain white screen was focused and clear
- Recorded the value of the lengths u and v and thereby marking these original points using a chalk on the bench.
- Then I adjusted the length of u by moving it away from the lens by 5cm. Consequently, I adjusted the length of v until a sharp and focused image was seen.
- Recorded this distance of u and v
- Repeated step 3 – 4 for 7 different values of u by increasing the distance by 5 cm in each step. And recorded the values of u and v for every increment.
- Then I placed the candle and the screen back in their original marked positions.
- Finally, repeated the steps 1-8 by using different convex lenses A, B, C, D and E.


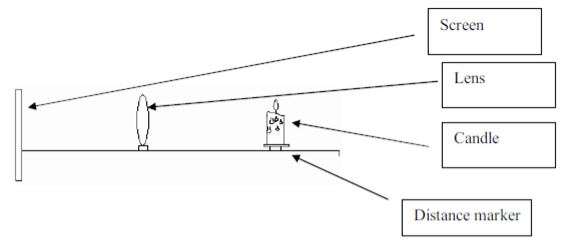
Figure 1: Setup of the apparatus for Part A
Part B:
- Firstly I set up the apparatus as shown in Figure 2 by making the distances v and u the same. So the image observed on a plain white screen was focused and clear
- Recorded the value of the lengths u and v and thereby marking these original points using a chalk on the bench.
- Then I adjusted the length of u by moving it away from the lens by 5cm. Consequently, I adjusted the length of v until a sharp and focused image was seen. Recorded this distance of u and v
- Repeated step 3 – 4 for 4 different values of u by increasing the distance by 5 cm in each step. And recorded the values of u and v for every increment.
- Repeated the above steps 1-5, thrice.


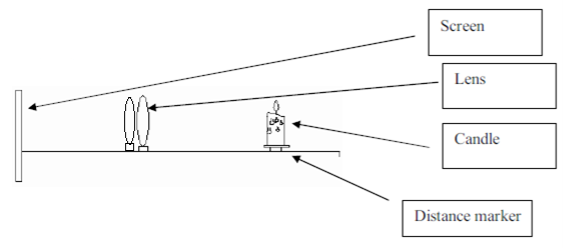
Figure 2: Setup of the apparatus for Part B
DATA COLLECTION AND PROCESSING:
- Part A:
Table 1: Data collected for convex lens A
|
u (distance between the lens and candle)+ 0.1cm |
v (distance between the lens and screen)+ 0.1cm |
|
15.0 |
25.1 |
|
20.0 |
21.5 |
|
25.0 |
17.0 |
|
30.0 |
14.7 |
|
35.0 |
14.2 |
|
40.0 |
13.6 |
|
45.0 |
13.0 |
Table 2: Data collected for convex lens B
|
u (distance between the lens and candle)+ 0.1cm |
v (distance between the lens and screen)+ 0.1cm |
|
15.0 |
28.9 |
|
20.0 |
24.2 |
|
25.0 |
19.2 |
|
30.0 |
15.8 |
|
35.0 |
13.9 |
|
40.0 |
13.2 |
|
45.0 |
12.7 |
Table 3: Data collected for convex lens C
|
u (distance between the lens and candle)+ 0.1cm |
v (distance between the lens and screen)+ 0.1cm |
|
15.0 |
24.6 |
|
20.0 |
21.1 |
|
25.0 |
16.5 |
|
30.0 |
14.3 |
|
35.0 |
13.9 |
|
40.0 |
13.4 |
|
45.0 |
12.9 |
Table 4: Data collected for convex lens D
|
u (distance between the lens and candle)+ 0.1cm |
v (distance between the lens and screen)+ 0.1cm |
|
15.0 |
28.7 |
|
20.0 |
23.6 |
|
25.0 |
17.4 |
|
30.0 |
14.9 |
|
35.0 |
14.0 |
|
40.0 |
13.4 |
|
45.0 |
13.0 |
Table 5: Data collected for convex lens E
|
u (distance between the lens and candle)+ 0.1cm |
v (distance between the lens and screen)+ 0.1cm |
|
15.0 |
25.8 |
|
20.0 |
20.1 |
|
25.0 |
15.4 |
|
30.0 |
14.3 |
|
35.0 |
13.9 |
|
40.0 |
13.1 |
|
45.0 |
12.5 |
- Part B:
Table 6: Data collected for Trial 1
|
u (distance between the lens and candle)+ 0.1cm |
v (distance between the lens and screen)+ 0.1cm |
|
30.0 |
60 |
|
40.0 |
38 |
|
50.0 |
33 |
|
60.0 |
30.1 |
Table 7: Data collected for Trial 2
|
u (distance between the lens and candle)+ 0.1cm |
v (distance between the lens and screen)+ 0.1cm |
|
30.0 |
58.7 |
|
40.0 |
37.8 |
|
50.0 |
32.6 |
|
60.0 |
30 |
Table 8: Data collected for Trial 3
|
u (distance between the lens and candle)+ 0.1cm |
v (distance between the lens and screen)+ 0.1cm |
|
30.0 |
61.5 |
|
40.0 |
38.7 |
|
50.0 |
33.2 |
|
60.0 |
29.6 |
Using the formula, R = 2f I can calculate the value for the radius of curvature. The value of f can be found using the equation.
- Part A:
Table 9:Data processing for convex lens A
|
u (distance between the lens and candle) + 0.1cm |
v (distance between the lens and screen) + 0.1cm |
Focal length (f) (cm) |
Radius of curvature (R) (cm) |
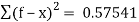
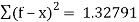
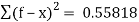
(f-x) |
(f-x)2 |
|
15 |
25.1 |
9.39 |
18.78 |
-0.62 |
0.38603 |
|
20 |
21.5 |
10.36 |
20.72 |
0.35 |
0.12328 |
|
25 |
17.0 |
10.12 |
20.24 |
0.11 |
0.01182 |
|
30 |
14.7 |
9.87 |
19.73 |
-0.14 |
0.02090 |
|
35 |
14.2 |
10.10 |
20.20 |
0.09 |
0.00833 |
|
40 |
13.6 |
10.15 |
20.30 |
0.14 |
0.01930 |
|
45 |
13.0 |
10.09 |
20.17 |
0.08 |
0.00576 |
|
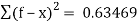
Mean(f) = 10.01 |
|
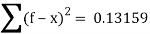
Standard deviation: δm =  =
= = 0.30967
Therefore, the focal length is 10.01+ 0.31 cm
The % error =  = 3.1%
Table 10:Data processing for convex lens B
|
u (distance between the lens and candle) + 0.1cm |
v (distance between the lens and screen) + 0.1cm |
Focal length (f) (cm) |
Radius of curvature (R) (cm) |
(f-x) |
(f-x)2 |
|
15 |
28.9 |
9.87 |
19.75 |
-0.38 |
0.14761 |
|
20 |
24.2 |
10.95 |
21.90 |
0.69 |
0.47792 |
|
25 |
19.2 |
10.86 |
21.72 |
0.60 |
0.36098 |
|
30 |
15.8 |
10.35 |
20.70 |
0.09 |
0.00818 |
|
35 |
13.9 |
9.95 |
19.90 |
-0.31 |
0.09612 |
|
40 |
13.2 |
9.92 |
19.85 |
-0.33 |
0.11162 |
|
45 |
12.7 |
9.90 |
19.81 |
-0.35 |
0.12548 |
|
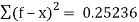
Mean(f) = 10.26 |
|
Standard deviation: δm = = = 0.47044
Therefore, the focal length is 10.26+ 0.47 cm
The % error =  = 4.6%
Table 11:Data processing for convex lens C
|
u (distance between the lens and candle) + 0.1cm |
v (distance between the lens and screen) + 0.1cm |
Focal length (f) (cm) |
Radius of curvature (R) (cm) |
(f-x) |
(f-x)2 |
|
15 |
24.6 |
9.32 |
18.64 |
-0.57 |
0.32564 |
|
20 |
21.1 |
10.27 |
20.54 |
0.38 |
0.14350 |
|
25 |
16.5 |
9.94 |
19.88 |
0.05 |
0.00259 |
|
30 |
14.3 |
9.68 |
19.37 |
-0.20 |
0.04197 |
|
35 |
13.9 |
9.95 |
19.90 |
0.06 |
0.00361 |
|
40 |
13.4 |
10.04 |
20.07 |
0.15 |
0.02209 |
|
45 |
12.9 |
10.03 |
20.05 |
0.14 |
0.01879 |
|
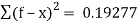
Mean(f) = 9.89 |
|
Standard deviation: δm = = = 0.30500
Therefore, the focal length is 9.89+ 0.31 cm
The % error =  = 3.1%
Table 12:Data processing for convex lens D
|
u (distance between the lens and candle) + 0.1cm |
v (distance between the lens and screen) + 0.1cm |
Focal length (f) (cm) |
Radius of curvature (R) (cm) |
(f-x) |
(f-x)2 |
|
15 |
28.7 |
9.85 |
19.70 |
-0.29 |
0.08633 |
|
20 |
23.6 |
10.83 |
21.65 |
0.68 |
0.46324 |
|
25 |
17.4 |
10.26 |
20.52 |
0.11 |
0.01308 |
|
30 |
14.9 |
9.96 |
19.91 |
-0.19 |
0.03595 |
|
35 |
14.0 |
10.00 |
20.00 |
-0.15 |
0.02105 |
|
40 |
13.4 |
10.04 |
20.07 |
-0.11 |
0.01158 |
|
45 |
13.0 |
10.09 |
20.17 |
-0.06 |
0.00346 |
|
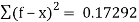
Mean(f) = 10.15 |
|
Standard deviation: δm = = = 0.32524
Therefore, the focal length is 10.15+ 0.33 cm
The % error =  = 3.2%
Table 13:Data processing for convex lens E
|
u (distance between the lens and candle) + 0.1cm |
v (distance between the lens and screen) + 0.1cm |
Focal length (f) (cm) |
Radius of curvature (R) (cm) |
(f-x) |
(f-x)2 |
|
15 |
25.8 |
9.49 |
18.97 |
-0.28 |
0.07574 |
|
20 |
20.1 |
10.02 |
20.05 |
0.26 |
0.06992 |
|
25 |
15.4 |
9.53 |
19.06 |
-0.23 |
0.05327 |
|
30 |
14.3 |
9.68 |
19.37 |
-0.08 |
0.00586 |
|
35 |
13.9 |
9.95 |
19.90 |
0.19 |
0.03548 |
|
40 |
13.1 |
9.87 |
19.74 |
0.11 |
0.01159 |
|
45 |
12.5 |
9.78 |
19.57 |
0.02 |
0.00049 |
|
Mean(f) = 9.76 |
|
Standard deviation: δm = = = 0.20508
Therefore, the focal length is 9.76 + 0.20508 cm
The % error =  = 2.1%
- Part B:
Table 14: Data processing for Trial 1
|
u (distance between the lens and candle) + 0.1cm |
v (distance between the lens and screen) + 0.1cm |
Focal length (f) (cm) |
Radius of curvature (R) (cm) |
(f-x) |
(f-x)2 |
|
30 |
60.0 |
20.00 |
40.00 |
0.15 |
0.02168 |
|
40 |
38.0 |
19.49 |
38.97 |
-0.37 |
0.13366 |
|
50 |
33.0 |
19.88 |
39.76 |
0.03 |
0.00072 |
|
60 |
30.1 |
20.04 |
40.09 |
0.19 |
0.03672 |
|
Mean(f) = 19.85 |
|
Standard deviation: δm = = = 0.43905
Therefore, the focal length is 19.85 + 0.44cm
The % error =  = 2.2%
Table 15: Data processing for Trial 2
|
u (distance between the lens and candle) + 0.1cm |
v (distance between the lens and screen) + 0.1cm |
Focal length (f) (cm) |
Radius of curvature (R) (cm) |
(f-x) |
(f-x)2 |
|
30 |
58.7 |
19.85 |
39.71 |
0.10 |
0.00961 |
|
40 |
37.8 |
19.43 |
38.87 |
-0.32 |
0.10300 |
|
50 |
32.6 |
19.73 |
39.47 |
-0.02 |
0.00047 |
|
60 |
30.0 |
20.00 |
40.00 |
0.24 |
0.05984 |
|
Mean(f) = 19.76 |
|
Standard deviation: δm = = = 0.16976
Therefore, the focal length is 19.76 + 0.17 cm
The % error =  = 0.9%
Table 16: Data processing for Trial 3
|
u (distance between the lens and candle) + 0.1cm |
v (distance between the lens and screen) + 0.1cm |
Focal length (f) (cm) |
Radius of curvature (R) (cm) |
(f-x) |
(f-x)2 |
|
30 |
61.5 |
20.16 |
40.33 |
0.26 |
0.06875 |
|
40 |
38.7 |
19.67 |
39.34 |
-0.23 |
0.05387 |
|
50 |
33.2 |
19.95 |
39.90 |
0.05 |
0.00252 |
|
60 |
29.6 |
19.82 |
39.64 |
-0.08 |
0.00645 |
|
Mean(f) = 19.90 |
|
Standard deviation: δm = = = 0.14809
Therefore, the focal length is 19.90 + 0.15 cm
The % error =  = 2.2%
CALCULATIONS AND DATA PRESENTATION:
Table 17: Data presentation for Convex lens A
|
|
|
|
 (cm)-1
 (cm)-1
 (cm)-1
Cite This Work
To export a reference to this article please select a referencing stye below:
Related Services
View all


DMCA / Removal Request
If you are the original writer of this essay and no longer wish to have your work published on UKEssays.com then please click the following link to email our support team:
Request essay removal