Effect of Zn Concentration on NiZnFe2O4 Nanoparticles
| ✅ Paper Type: Free Essay | ✅ Subject: Physics |
| ✅ Wordcount: 1979 words | ✅ Published: 12 Mar 2018 |
CHAPTER-7
EFFECT OF Zn CONCENTRATION ON MAGNETIC AND DIELECTRIC PROPERTIES OF NiZnFe2O4 NANOPARTICLES
7.1 INTRODUCTION
Ni (1-x) Zn (x) Fe2O4 (x=0.2, 0.4 and 0.6) nanoparticles are synthesized by using coprecipitation method. Zinc is a known metal, its role is important in the modification of ferrite properties by redistribution over the tetrahedral and octahedral sites of the spinel lattice. Rath et al (2002) reported the effect of zinc substitution on lattice parameter and magnetic properties on Mn-Zn ferrites prepared by hydrothermal precipitation method. Arulmurugan et al (2005) studied the effect of zinc substitution on Co-Zn and Mn-Zn ferrite nanoparticles prepared by coprecipitaion method.
This chapter discusses the effect of zinc concentration on structural, magnetic and dielectric properties of NiZnFe2O4 nanoparticles prepared by co-precipitation method. The detailed experimental procedure involved in the preparation of NiZn ferrite nanoparticles has been already reported in chapter IV. In this method three different compositions such as x=0.2, x=0.4 and x=0.6 were used in the chemical formula Ni (1-x) Zn(x) Fe2O4 to analyze the properties of the ferrite nanoparticles.
7.2 RESULTS AND DISCUSSION
7.2.1 X-ray Diffraction (XRD) analysis
The average crystallite size ‘t’ and the lattice parameter ‘a’ were calculated from X-ray diffraction data as reported in the chapter –IV. The values of particle size and Lattice parameter of all samples are also tabulated in Tables 7.1, 7.2 and 7.3.
The particle size decreased from 24 to 12nm with the increase of Zn concentration. The same behavior of decrease in particle size with the increase of zinc concentration was also observed for the samples sintered at 600°C and 900°C. The decrease in particle size due to the increase of zinc concentration was 26 to 20nm for sintered sample at 600°C and 31 to 25 nm for sintered sample at 900°C respectively.
This variation of particle size with zinc concentration at the above mentioned sintering temperature of Ni Zn ferrites nano particles is shown in Fig.7.1. The above observation shows that the presence of zinc blocks the grain growth.
The surface temperature affects the molecular concentration at the surface of the crystal, and hence, the crystal growth (Upadhyay et at 2004). The formation of Zn-ferrite is more exothermic as compared with the formation of Ni-ferrite (Navrotsky & Kleppa 1968). Thus, the crystal surface temperature increases with addition of zinc, decreasing the molecular concentration at the crystal surface and hence, obstructing the grain growth.

The effects of zinc concentration on structural, magnetic and dielectric properties of Ni-Zn ferrite nano particles were studied. Particle size decreased with the increase of concentration. This decreasing in particle size behavior was observed for all the categories of concentration variation at different sintering temperature levels. The effect of zinc concentration on particle size showed a reverse effect compared with the effect of sintering temperature (chapter-IV), in which the particle sizes increased with the increase of sintering temperature.
Table 7.1Particle size and Lattice parameter of as prepared Ni (1-x) Zn (x) Fe2O4
(x= 0.2, 0.4 and 0.6) nano particles
|
Sintering Temperature (°C) |
Zinc concentration (x) |
Particle size (nm) |
Lattice parameter (Å) |
|
As prepared |
0.2 |
24 |
8.334 |
|
0.4 |
21 |
8.351 |
|
|
0.6 |
12 |
8.375 |
Table 7.2 Particle size and Lattice parameter of Ni (1-x) Zn (x) Fe2O4
(x= 0.2, 0.4 and 0.6) nano particles sintered at 600°C
|
Sintering Temperature (°C) |
Zinc concentration (x) |
Particle size (nm) |
Lattice parameter (Å) |
|
600 |
0.2 |
26 |
8.630 |
|
0.4 |
22 |
8.641 |
|
|
0.6 |
20 |
8.667 |
Table 7.3 Particle size and Lattice parameter of Ni (1-x) Zn (x) Fe2O4
(x= 0.2, 0.4 and 0.6) nano particles sintered at 900°C
|
Sintering Temperature (°C) |
Zinc concentration (x) |
Particle size (nm) |
Lattice parameter (Å) |
|
900 |
0.2 |
31 |
8.648 |
|
0.4 |
28 |
8.658 |
|
|
0.6 |
25 |
8.682 |
From Tables 7.1, 7.2 and 7.3 it is also observed that the lattice parameter increases with the increase of zinc concentration. The lattice parameter value for as prepared are increased from 8.33 to 8.37Å with the increase of zinc. For the samples sintered at 600°C the lattice parameter value for lower zinc concentration (x=0.2) is 8.63Å and higher zinc concentration (x=0.6) is 8.66 Å. The similar behavior of increase in lattice parameter with zinc concentration is also observed as 8.64 to 8.68 Å in the samples sintered at 900°C. This increase of lattice parameter with zinc concentration for all sintering temperatures of Ni Zn ferrites nano particles are also shown in Fig.7.2. The addition of Zn2+ in Ni-ferrite causes the Fe3+ ions to migrate from A site to B site. The larger ionic radius of zinc (0.82Å), compared with ferric ion (0.67 Å), makes the A site and thus the lattice expands, increasing the lattice parameter. A similar variation of particle size and lattice parameter with zinc content had been observed by Joshi & Kulkarrni (1986) for Mg-Zn Ferrite.
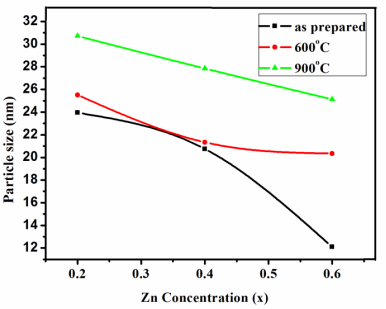
Fig.7.1Variation of particle size with zinc concentration for all sintering temperatures
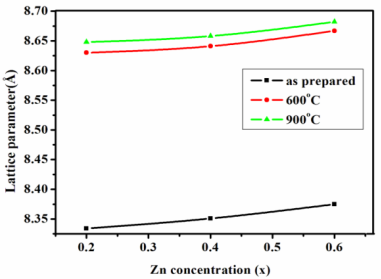
Fig.7.2Variation of lattice parameter with zinc concentration for
all sintering temperature
7.2.2 Magnetic Properties
The room temperature B-H hysteresis loops of Ni (1-x) Zn (x) Fe2 O4 nano particles for different zinc concentration (x = 0.2, 0.4 and 0.6) sintered at 600°C and 900°C are shown in Figs.7.3 (a), 7.3 (b) and 7.3 (c). The variations of magnetic properties such as saturation magnetization (Ms), and coercivity (Hc) for different zinc concentrations (x = 0.2, 0.4 and 0.6) at particular sintering temperature were calculated from the hysteresis data and tabulated in Tables 7.4, 7.5 and 7.6.
Table 7.4 Saturation magnetization and coercivity values of as prepared
Ni (1-x) Zn (x) Fe2O4 (x= 0.2, 0.4 and 0.6) nano particles
|
Sintering Temperature (°C) |
Zinc concentration (x) |
Saturation magnetization Ms (emu/g) |
Coercivity Hc (Gauss) |
|
As prepared |
0.2 |
29.73 |
324.36 |
|
0.4 |
28.72 |
310.12 |
|
|
0.6 |
6.98 |
306.56 |
Table 7.5 Saturation magnetization and coercivity values of Ni (1-x) Zn (x) Fe2O4
(x= 0.2, 0.4 and 0.6) nano particles sintered at 600°C
|
Sintering Temperature (°C) |
Zinc concentration (x) |
Saturation magnetization Ms (emu/g) |
Coercivity Hc (Gauss) |
|
600°C |
0.2 |
32.78 |
347.31 |
|
0.4 |
32.72 |
345.12 |
|
|
0.6 |
25.80 |
340.72 |
Table 7.6 Saturation magnetization and coercivity values of Ni (1-x) Zn (x) Fe2O4
(x= 0.2, 0.4 and 0.6) nano particles sintered at 900°C
|
Sintering Temperature (°C) |
Zinc concentration (x) |
Saturation magnetization Ms (emu/g) |
Coercivity Hc (Gauss) |
|
900°C |
0.2 |
64.34 |
386.67 |
|
0.4 |
54.14 |
356.50 |
|
|
0.6 |
39.50 |
351.34 |
The effect of zinc concentration on magnetic properties such as saturation magnetization and coercivity of all compositions of Ni Zn ferrite nano particles sintered at 600°C and 900°C are shown in Figs.7.4 and 7.5. The Fig.7.4 reveals that the saturation magnetization (Ms) decreases with the increase of zinc concentration. The saturation magnetization value decreased from 29.73 to 6.98 emu/g with the increase of zinc concentration for as prepared samples. The saturation magnetization value for the 600°C sintered samples at lower zinc concentration (x=0.2) was 32.78 emu/g and higher zinc concentration (x=0.6) was 25.80 emu/g. A similar behavior of decrease in saturation magnetization with zinc concentration was also observed in the samples sintered at 900°C as 64.34 to 39.50 emu/g.
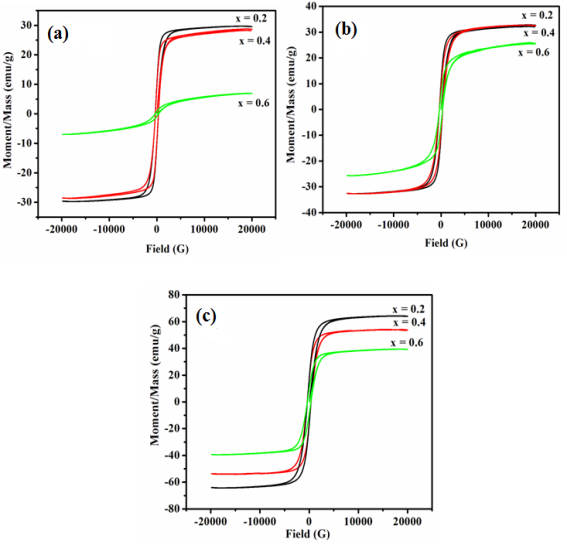
Fig.7.3 Hysteresis loops of Ni (1-x) Zn (x) Fe2 O4 nano particles for different zinc concentration (x = 0.2, 0.4 and 0.6)
(a) as prepared (b) 600°C sintered (c) 900°C sintered samples
This decreasing of saturation magnetization with the increase of non magnetic Zn concentration is due to the interaction created by the zinc in the tetrahedral and octahedral sites. This shows the weakening of A-B interaction, whereas B-B interaction changes from ferromagnetic to antiferromagnetic state. The occurrence of minor decrease in saturation magnetization is also evidenced from the dielectric study, because it shows that there is a minor increase in dielectric constant. This reason leads to the conclusion that saturation magnetization variation with respect to concentration for 600°C and 900°C samples did not cause a rapid decrease in saturation magnetization like as prepared sample.
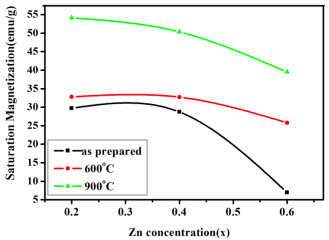 Fig.7.5 shows that the coercivity values of NiZn ferrite nanoparticles decrease with the increase of zinc concentration. The coercivity values of as prepared nanoparticles decrease from 324.36 to 306.56 Gauss. Similarly the variation of coercivity values of nanocrystalline NiZn ferrite particles with increase of Zn concentration sintered at 600°C and 900°C are in the range of 347.31- 340.72 Gauss and 386.67-351.34 Gauss. This is due to the decreases of magneto crystalline anisotropy constant. The magneto crystalline anisotropy constant is negative for both Ni and Zn ferrites. The absolute value of magneto crystalline anisotropy constant larger for Ni ferrites than that of Zn ferrites (Verma et al 2000). The total anisotropy is equal to the sum of their individual anisotropy. So magneto crystalline anisotropy constant and hence coercivity decreases with the increase in Zn concentration. Also reasons behind the decrease in saturation magnetization and decrease in coercivity are clearly identified from the formation of smaller particle size even at the higher Zn concentration at all sintering temperatures.
Fig.7.4 Variation of saturation magnetization with zinc concentration
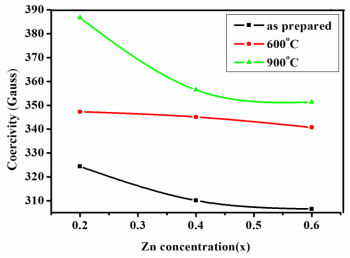
Fig.7.5 Variation of coercivity with zinc concentration
7.2.3 Dielectric properties
The effect of zinc concentration on dielectric constant of all samples of Ni (1-x) Zn (x) Fe2 O4 nano particles are shown in Figs.7.6 (a), 7.6 (b) and 7.6 (c). The values of dielectric constant and dielectric loss are tabulated in Tables 7.7, 7.8 and 7.9.
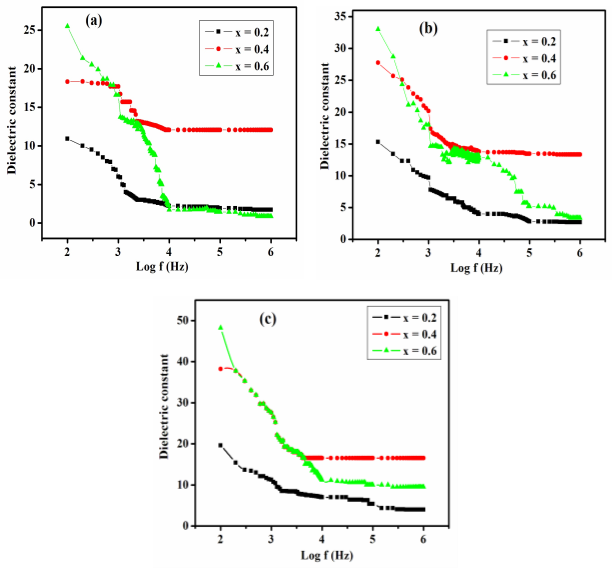
Fig.7.6 Dielectric constant curves of Ni (1-x) Zn (x) Fe2 O4 nano particles for
different zinc concentration (x = 0.2, 0.4 and 0.6)
(a) as prepared (b) 600°C sintered (c) 900°C sintered samples
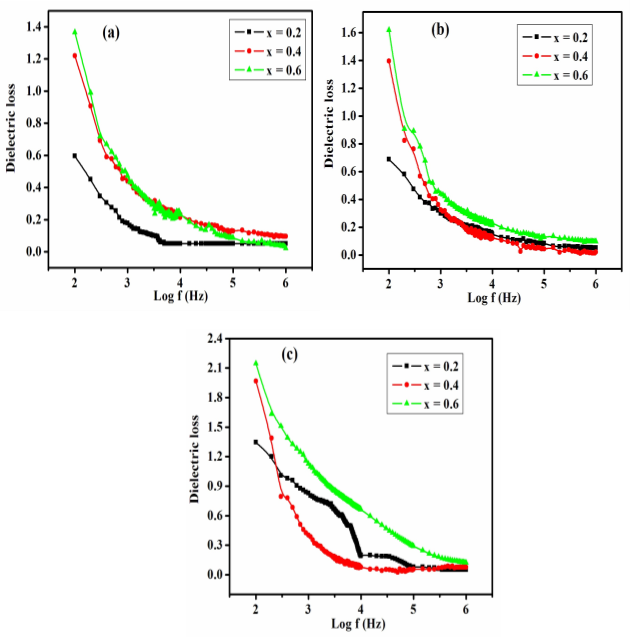
Fig. 7.7 Dielectric loss curves of Ni (1-x) Zn (x) Fe2 O4 nano particles for different zinc concentration (x = 0.2, 0.4 and 0.6)
(a) as prepared (b) 600°C sintered (c) 900°C sintered samples
The dielectric constant attained for zinc concentration x =0.6 led to a higher value for all the samples. The variations of dielectric constant with zinc concentration for all samples are also shown in Fig. 7.8. For all as prepared samples, the dielectric constant value increased from 10.92 to 25.08 with the increase of zinc concentration. The dielectric constant value for the samples sintered at 600°C in lower zinc concentration (x=0.2) was 15.33 and it increased to 32.86 at higher zinc concentration (x=0.6). A similar behavior of increase in dielectric constant with increase in zinc concentration was also observed in the samples sintered at 900°C as 19.37 to 48.18.
Table 7.7 Dielectric constant and Dielectric loss values as prepared
Ni (1-x) Zn (x) Fe2O4 (x= 0.2, 0.4 and 0.6) nano particles
|
Sintering Temperature (°C) |
Zinc concentration (x) |
Dielectric constant (Î) |
Dielectric Loss (D) |
|
As prepared |
0.2 |
10.92 |
0.59 |
|
0.4 |
18.19 |
1.20 |
|
|
0.6 |
25.08 |
1.36 |
Table 7.8 Dielectric constant and Dielectric loss values of Ni (1-x) Zn (x) Fe2O4 (x= 0.2, 0.4 and 0.6) nano particles sintered at 600°C
|
Sintering Temperature (°C) |
Zinc concentration (x) |
Dielectric constant (Î) |
Dielectric Loss (D) |
|
600°C |
0.2 |
15.33 |
0.68 |
|
0.4 |
27.80 |
1.38 |
|
|
0.6 |
32.86 |
1.61 |
Table 7.9 Dielectric constant and Dielectric loss values of Ni (1-x) Zn (x) Fe2O4 (x= 0.2, 0.4 and 0.6) nano particles sintered at 900°C
|
Sintering Temperature (°C) |
Zinc concentration (x) |
Dielectric constant (Î) |
Dielectric Loss (D) |
|
900°C |
0.2 |
19.37 |
1.34 |
|
0.4 |
38.3 |
1.95 |
|
|
0.6 |
48.18 |
2.14 |
Figs.7.7 (a), 7.7 (b) and 7.3 (c) show the effect on zinc concentration on dielectric loss factor of all samples of Ni (1-x) Zn (x) Fe2 O4 nano particles. The variation of dielectric loss factor value with zinc concentration for all sintering temperatures is also shown in Fig. 7.9. For all as prepared samples the dielectric loss factor value increased from 0.59 to 1.36 with the increase of zinc concentration. For the samples sintered at 600°C the dielectric loss factor value for lower zinc concentration (x=0.2) was 0.68 and at higher zinc concentration (x=0.6) it was 1.61. A similar behavior of increase in dielectric loss with increase in zinc concentration was also observed in the samples sintered at 900°C as 1.34 to 2.14.
In Ni-Zn ferrites Zn occupies [A] site and Ni occupies [B]site, while Fe occupies both [A] and [B] sites. When Zn2+ is added in the place of Ni2+, with increase in Zn composition x, some of the Fe3+ ions get converted into Fe2+ ions. This increases the hopping between Fe3+ and Fe2+ ions, thereby decreasing the resistance of the grain. This increases the probability of electrons reaching the grain boundary. Hence the polarization and the dielectric constant increase.
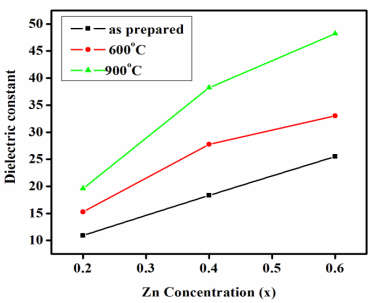
Fig.7.8 Variation of dielectric constant with zinc concentration
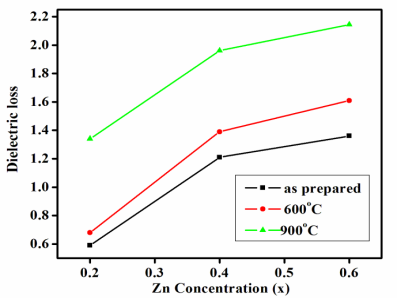
Fig.7.9 Variation of dielectric loss with zinc concentration
7.3 CONCLUSION
The effects of zinc concentration on structural, magnetic and dielectric properties of Ni-Zn ferrite nano particles were studied. The increase in zinc concentration obstructed the grain growth and decreased the particles size. The larger ionic radius of Zn, increased the lattice parameter values of NiZn ferrite nanoparticles with the increase of its concentration. The non magnetic property of zinc, decreased the saturation magnetization and coercivity values of NiZn ferrite nanoparticles. The dielectric constant and dielectric loss factor values also increased with the increase of zinc concentration due to the increase of probability of electrons reaching the grain boundary. Low value of particle size obtained at higher zinc concentration in the present work indicated that NiZn ferrite nano particles in lower nanometer scale could be obtained at higher zinc concentration.
Cite This Work
To export a reference to this article please select a referencing stye below:
Related Services
View all


DMCA / Removal Request
If you are the original writer of this essay and no longer wish to have your work published on UKEssays.com then please click the following link to email our support team:
Request essay removal