Data Analysis Chapter Analysis
| ✅ Paper Type: Free Essay | ✅ Subject: Statistics |
| ✅ Wordcount: 1204 words | ✅ Published: 07 Sep 2017 |
Part One:
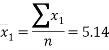
Based on my NTU username (N0687816), my data set is: (0,6,8,7,8,1,6)
Section A)
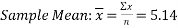
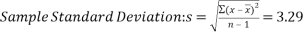
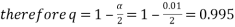
Forming a 99% confidence interval for my data set:


Our confidence interval is: 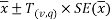
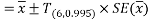

We can therefore say with 99% confidence that the mean number of tattoos per student for the population of all students at NTU is between 0.54 and 9.74
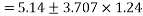
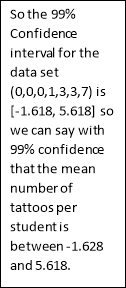
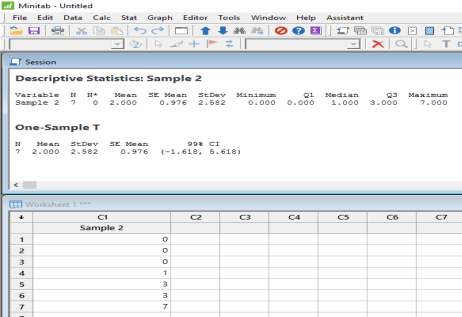
Using Minitab for a 99% confidence interval for data set (0,0,0,1,3,3,7):
Section B)
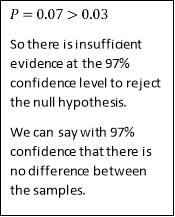
Looking for evidence at the 97% confidence level of a difference between the samples:
|
Sample 1 (0,6,8,7,8,1,6) |
Sample 2 (0,0,0,1,3,3,7) |
|
|
Sample sizes |
|
|
|
Sample means |
|
|
|
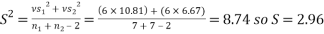
Sample variances |
|
|


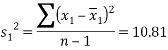
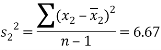
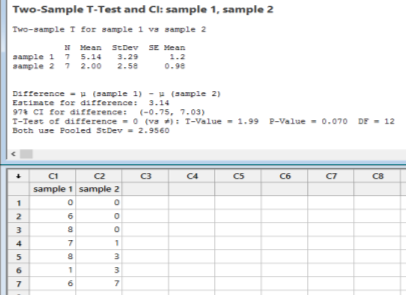
I am going to use a two-sample T test to analyse this data as there are two small samples formed from data that is not paired.

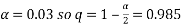


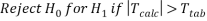

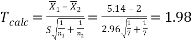
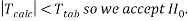
We can say with 97% confidence that there is no difference between the two samples.
Using Minitab:
Section C) Testing data from trialing a new inhaler
|
Person 1 |
Person 2 |
Person 3 |
Person 4 |
Person 5 |
Person 6 |
Person 7 |
|
|
Before |
0 |
6 |
8 |
7 |
8 |
1 |
6 |
|
After |
0 |
0 |
0 |
1 |
3 |
3 |
7 |
- To analyse this data, I will use a paired T-test as there are two sets of data for the same group of people (before and after using an inhaler). It is also unknown if the data is normally distributed and the sample is small which are both other factors which suggest the use of a T test. This test could be one or two tailed depending on whether you were looking for an improvement/reduction or a general change. In this case, however, we want the inhalers to have improved the people’s lung function so we will do a one tailed test.
Null hypothesis 
Alternative hypothesis . (The data is for recovery time in seconds so a reduction in the mean recovery time shows an improvement in lung function).
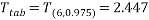
Decision Rule: 
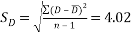
Performing the test:
Let 
So 

There is not a specified confidence interval so I will use a 95% confidence interval so:
Therefore: 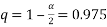
 
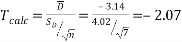

We can therefore say with 95% confidence that the inhaler did improve the lung function of the people who used it.
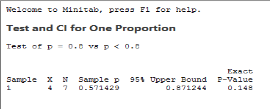
- Testing the Manufacturers Claim
I am going to use a one tailed hypothesis test. This is because it does not matter if the inhaler improves lung function in over 80% of cases, only if it does not reach this claim. I will take  to be that
  and
and  to be that
  .
.
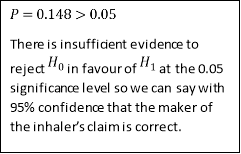 The lung function recovery time reduced in four of the seven trials so 4 events out of 7 trials, leading to
  andÂ
and 
Part Two:
Section A) The Lady Tasting Tea Experiment
The lady tasting tea experiment was a statistical experiment conducted by Ronald Fisher. As explained in “The lady tasting tea experiment” (Winkler, 2015), a lady claimed she could tell whether milk or tea was poured first in a cup of tea she tasted. Ronald Fisher’s book The Design of Experiments (see Winkler, 2015) outlined the ideas behind this test:
[It] consists in mixing eight cups of tea, four in one way and four in the other, and presenting them to the subject for judgement in a random order. The subject has been told in advance […] that she will be asked to taste eight cups, that these shall be four of each kind – Fisher, 1935.

According to Imai (2016), Fisher introduces the idea of a null hypothesis, which in this case, is the idea that the woman is guessing and cannot actually distinguish between the cups. Fisher then used the lady’s answers to work out the likelihood of her getting this result whilst guessing. From this, he found that there were 70 ways to choose 4 cups out of 8 and that from these, there was 1 way of getting none and four correct, 16 ways of getting one and three correct and 36 ways of getting two correct, as shown by Inglis-Arkell (2015).
Although pioneering, however, the test itself was not powerful. As explained by Stark (2010), the small sample size caused the probability of her guessing randomly only coming out less than 0.05 (the condition required to reject the null hypothesis) if she got a perfect score. This is because guessing all four correctly carried a probability of  whereas guessing three out of four correctly carried a probability of
  . This issue would have been reduced with a much bigger sample size.
For another mathematical example, we will look at the following question:
Suppose the lady samples 10 cups of tea, among which 5 had the tea
poured first and 5 had the milk poured first.
a. What is the probability she correctly identifies all five cups which had the tea poured first? – Sloughter, 2006.
Following the logic displayed by Stark (2010) for the lady tasting tea problem, there would be only 1 way of choosing all five correctly. Using the formula (Simmons, 2016), we get
  ways of choosing five cups of tea out of the ten. This means that the probability of getting all five correct is
  .
.
As stated by Inglis-Arkell (2015), the number of cups that the lady guessed correctly is unknown. Despite this, the lady tasting tea experiment is still extremely influential and led to Ronald Fisher being praised for his book The Design of Experiments due to how clearly he explained why randomisation is important and how he decided what would be acceptable evidence to accept or reject a statement.
Reference List
- Imai, K., 2013. Statistical Hypothesis Tests [online]. Princeton University. Available at: http://imai.princeton.edu/teaching/files/tests.pdf [Accessed 9th January 2017].
- Inglis-Arkell, E., 2015. How A Tea Party Turned Into A Scientific Legend [online]. Io9. Available at: http://io9.gizmodo.com/how-a-tea-party-turned-into-a-scientific-legend-1706697488 [Accessed 9th December 2016].
- Simmons, B., 2016. Combination Formula [online]. Mathwords. Available at: http://www.mathwords.com/c/combination_formula.htm [Accessed 9th January 2017].
- Sloughter, D., 2006. Mathematics of a Lady Tasting Tea [online]. Furman University. Available at: http://math.furman.edu/~dcs/courses/math15/lectures/lecture-19.pdf [Accessed 9th December 2016].
- Stark, P., 2010. StichiGui [online]. Available at: https://www.stat.berkeley.edu/~stark/Teach/S240/Notes/ch3.htm [Accessed 9th January 2017].
- Winkler, A. 2015. The lady tasting tea experiment [online]. Brainder. Available at: https://brainder.org/2015/08/23/the-lady-tasting-tea-and-fishers-exact-test/ [Accessed 5th December 2016].
Declaration:
1. I am aware of the University’s rules on plagiarism and collusion and I understand that, if I am found to have broken these rules, it will be treated as Academic Misconduct and dealt with accordingly. I understand that if I lend this piece of work to another student and they copy all or part of it, either with or without my knowledge or permission, I shall be guilty of collusion.
2. In submitting this work I confirm that I am aware of, and am abiding by, the University’s expectations for proof-reading.
3. I understand that I must submit this coursework by the time and date published. I also understand that if this coursework is submitted late it will, if submitted within 5 working days of the deadline date and time, be given a pass mark as a maximum mark. If received more than 5 working days after the deadline date and time, it will receive a mark of 0%. For referred or repeat coursework, I understand that if the coursework is not submitted by the published date and time, a mark of 0% will be automatically awarded.
4. I understand that it is entirely my responsibility to ensure that I hand in my full and complete coursework and that any missing pages handed in after the deadline will be disregarded.
5. I understand that the above rules apply even in the eventuality of computer or other information technology failures.
Sign                                                                                                  Date
Georgia Mold09/01/2017
_______________________________Â Â Â Â Â Â Â Â Â Â Â Â Â Â Â Â Â Â Â Â Â Â Â Â Â Â Â Â Â Â Â Â Â Â Â Â Â Â Â Â ________________________
Cite This Work
To export a reference to this article please select a referencing stye below:
Related Services
View all


DMCA / Removal Request
If you are the original writer of this essay and no longer wish to have your work published on UKEssays.com then please click the following link to email our support team:
Request essay removal